The table contains four types of columns: words, distances, frequency data, and hyperinks to examples.
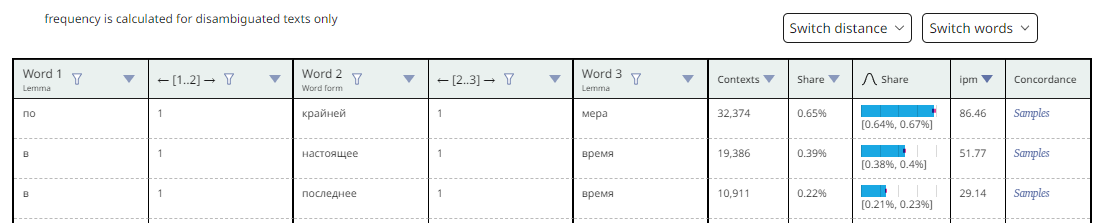
Each column with a word corresponds to one word from the query and has four display modes: Lemma, Word form, Grammatical features and Parts of speach. By default, the Lemma mode is enabled in all columns. The display modes for each word can be selected independently. This flexibility of setting up columns with words is convenient for generalizing or differentiating parts of phrases. For example, when studying government patterns of verbs, it is more convenient to turn on the Lemma display mode in the column with verbs, and the Wordform mode in the column with dependent nouns. When you change the display mode in columns with words, frequency data is also recalculated accordingly.
Columns with distances between adjacent query words make it possible to sort the list by distance and get the most frequent results with a minimum or maximum specified distance.
In columns with words and distances you can disable grouping and get the frequency of a combination of words with any distance between them (within the distance specified in the original query), or you can set grouping by lemma/word form/gram. features for some words, and look to the rest of the words without grouping. For example, by the query food + с + food you can get such frequency combinations of different dishes that are eaten with something else edible. By switching off grouping for the first word, we will understand what is most often added to any dishes.
Using the Switch distance and Switch words switches located above the table, you can set the display mode for all columns in the table at the same time.
The Contexts column shows the number of examples in which the phrase occurs. When you hover the mouse, you can see the confidence interval in which the calculated value is located.
The Percentage and Ipm columns contain information about how often the received phrase occurs in the selected corpus or subcorpus. The Percentage column shows the percentage of the phrase among all matching the search query. The ipm column shows the frequency of each word combination per million words of the corpus or subcorpus searched. For queries that have more than one million results, grouping is done based on a randomly selected million results.
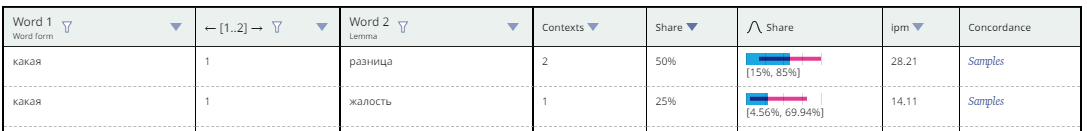
The values of the Percentage column are also presented in the form of histograms with specified confidence interval, which can be used to judge the accuracy of calculations and to compare the data correctly. For example, in the following case, it cannot be argued that the phrase какая разница "what's the difference" is more frequent than какая жалость "what a pity", since the confidence intervals intersect:
The Contexts, Share and Ipm columns can be sorted from highest to lowest.
The Concordance column contains the hyperlinks to all examples in which the search phrases were found.