The Russian National Corpus is a representative collection of texts in Russian, counting more than 2 bln tokens and completed with linguistic annotation and search tools


Search in corpora


News
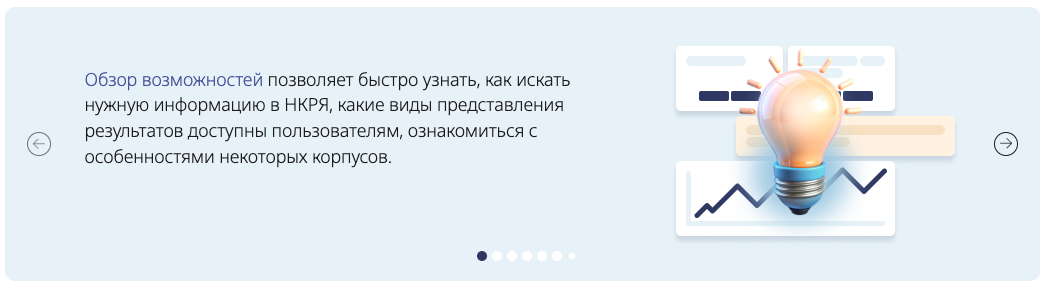
For users who are just getting acquainted with the Corpus, the “Features Overview" is available on the main page.
In October, we enhanced this service by adding new widgets and making existing widgets more informative. Now, the "Features Overview" is common across all RNC corpora.
A new text widget has been introduced that allows users to familiarize themselves with the basic terms used in the RNC interface, learn how to start a search, understand the different types of searches available, and find out where to read more about them.
Lemma ang tags search, exact search, and collocation search now yield results only from the Main Corpus.
The "Random Poem" widget now displays not only the poem itself but also its title, author, and date of creation.
The names of the corpora in the widget headers are now clickable. By clicking on the link, users will be directed to the "Portrait of the Corpus," where they can explore its structure, learn more about the creators of the corpus, and read publications about it.
The collections in the Accentological and Spoken corpora were updated. We added transcripts of expert talks, oral memories, and everyday dialogic speech. These texts were recorded in different regions, including Moscow, Tomsk, and Voronezh Oblasts, Republics of Buryatia and Mari El.
We would like to thank for collecting and processing the texts: students and staff of the Voronezh State University, students of the Lomonosov Moscow State University, Grigori Korotkikh (Ilshat association, Tomsk), Egor Kashkin (Group for the Study of Contact Interaction of Russian with Indigenous Languages of Russia, Vinogradov Russian Language Institute).
The size of the Spoken Corpus amounts to 14,8 million tokens, the total size of the Accentological corpus, including naive poetry, is 134.8 million tokens.
In both corpora, it is now possible to select texts by number of word forms. In the subcorpus selection form, regions in the Spoken Corpus are now grouped by countries for easy searching.
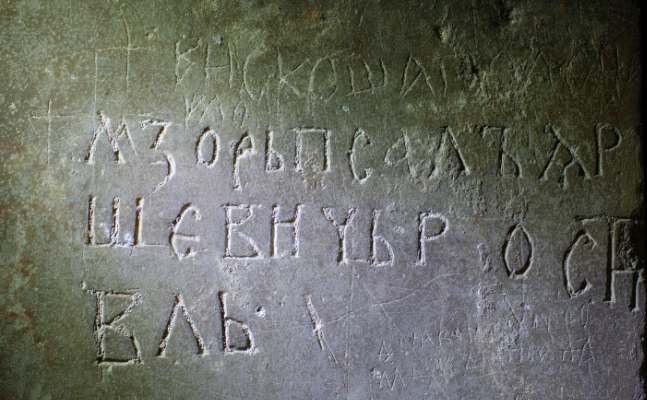
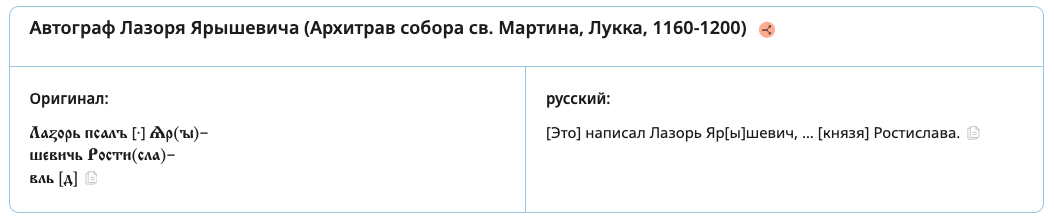
The East Slavic epigraphy corpus now features 86 newly described inscriptions dating from the 11th to the 14th centuries and originating from diverse locations including Lucca, Bethlehem, Constantinople/Istanbul, Kiev/Kyiv, or Tver. The texts range from an inscription on a princely weapon to riddles and curses. The overall size of the corpus is 6 thousand tokens.
The user can now select subcorpus by number of words (i. e. longer or shorter inscriptions), and has an option to search only in the Russian translations.
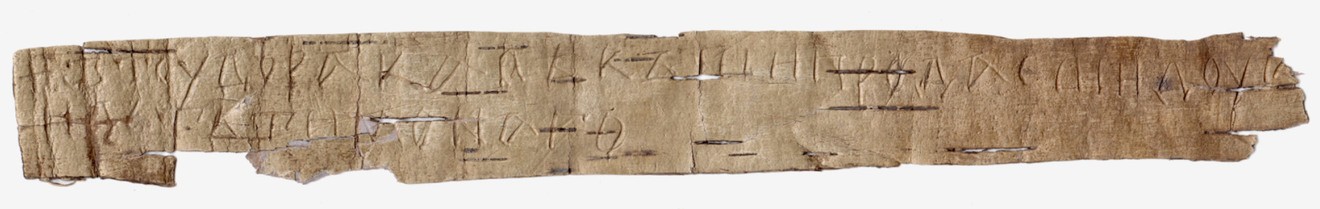
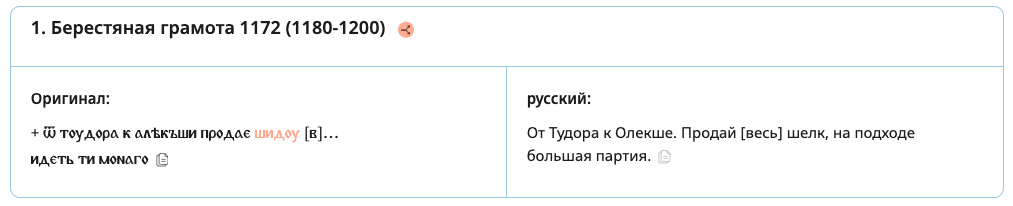
The Birchbark letters corpus now features 19 documents from Novgorod and Staraya Russa, found in 2023. They contain more than 300 tokens. In addition, the texts and translations of previously found birchbark letters were corrected. The corpus includes such new words as ѣздець ('rider'), шида ('silk'), немочи ('to be ill'), крута ('dowry'). Such common words as огородъ (garden), капуста (cabbage), боꙗринъ (boyar) were also encountered for the first time in the new documents.
The search options have been significantly improved, and new tags related to grammar and interpretation can be specified in the query form.