Statistics in corpus portrait
The Statistics section in the corpus portrait contains tables, graphs and diagrams that show the actual and diachronic statistics of the corpus:
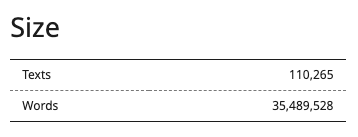
- A table and a graph showing the size of the corpus (number of texts and words).
- A geographical map and a graph of text distribution by countries and regions (only for corpora with regional mark-up).
- A pie chart and a graph showing the distribution of meta-attribute values.
You can access the corpus statistics through the corpus portrait by clicking the (i) button in the corpus header.
All charts and graphs are provided with a standard tooltip (?), which explains how to interpret the visualization, and can be downloaded as an Excel/CSV file or a screenshot.
At the moment statistics is available for the Main, Educational, Media corpora, some historical corpora as well as "Russian classics" and "From 2 to 15". Later, it will be added to more corpora.
Actual statistics
Corpus size
Corpus size in Actual statistics section is shown in texts and in words:
Map
The geographical map shows the regional distribution of the corpus in the selected units of measurement (texts or words). When you switch between units, the map is redrawn.
The size of the corpus in a particular region is shown by the color scale. When you hover the mouse over the shaded area, you can see the name of the region and the corresponding number of texts or words in the corpus.
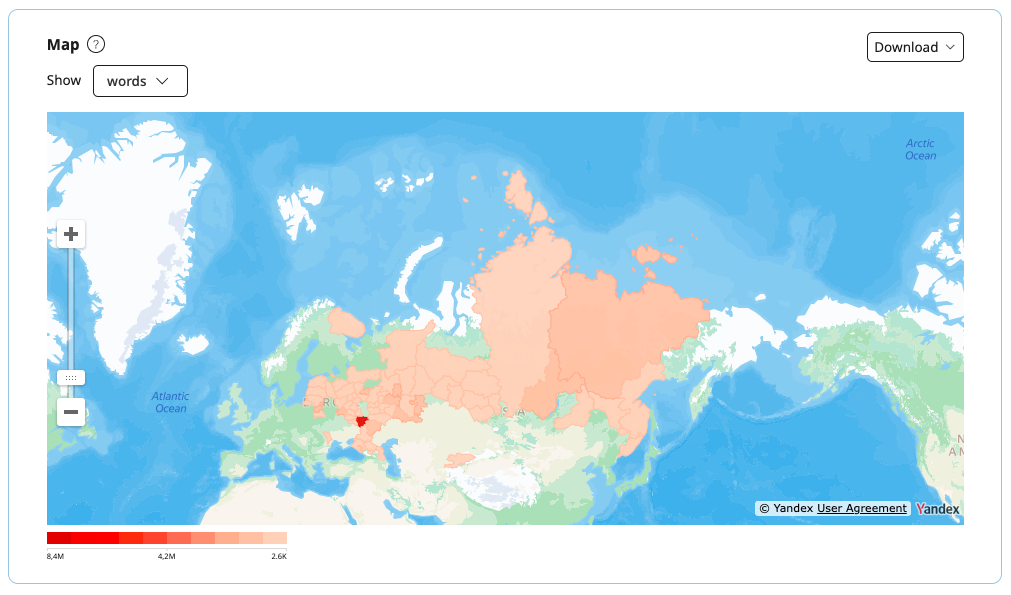
You can download an Excel/CSV file ith the original data used to build the map.
Distribution of texts
The pie chart shows what kinds of texts are presented in the corpus. You can select the meta-attribute for which the diagram is to be plotted from the list of the most representative attributes of the corpus, as well as the unit of size measurement: texts or words. When switching meta-attribute and/or unit of measurement, the chart is redrawn.
The diagram shows the distribution of the top ten values of the selected meta-attribute. The remaining values are grouped under the Other category. To the right of the chart is the list of values and the percentage. When you hover the mouse over a sector of the chart, you can see the name of the value and the corresponding number of texts or words in the corpus.
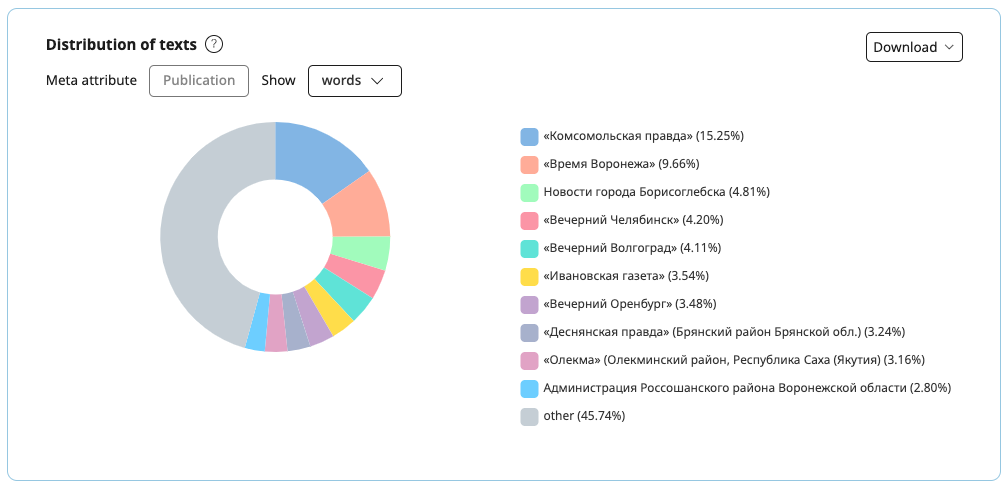
You can download an Excel/CSV file with the source data used to build the charts, as well as the chart as an image.
The user's subcorpus and the whole corpus can be compared using the Statistics in corpus portrait.
Diachronic statistics
In Diachronic statistics section you can set the distribution, dates, and smoothing of frequencies. The specified parameters are applied to all graphs on the page.
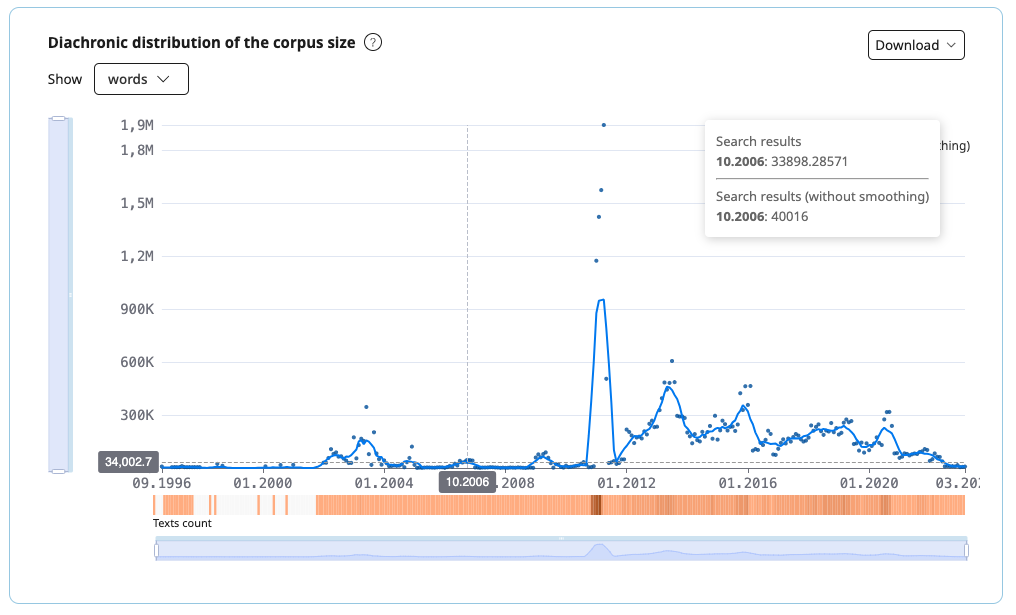
Diachronic distribution of the corpus size
On the graph you can see corpus size in texts and in words. The X-axis indicates the date when the text was created, and the Y-axis indicates the number of corpus texts created on that date.
Distribution of texts
The graph Distribution of texts shows which types of texts are represented in the corpus. The user can select which meta attribute to build a graph for from the list of the most significant attributes of the corpus, as well as the preferred unit of measurement (texts or words). When you switch the meta attribute and/or unit of measurement, the graph gets redrawn.
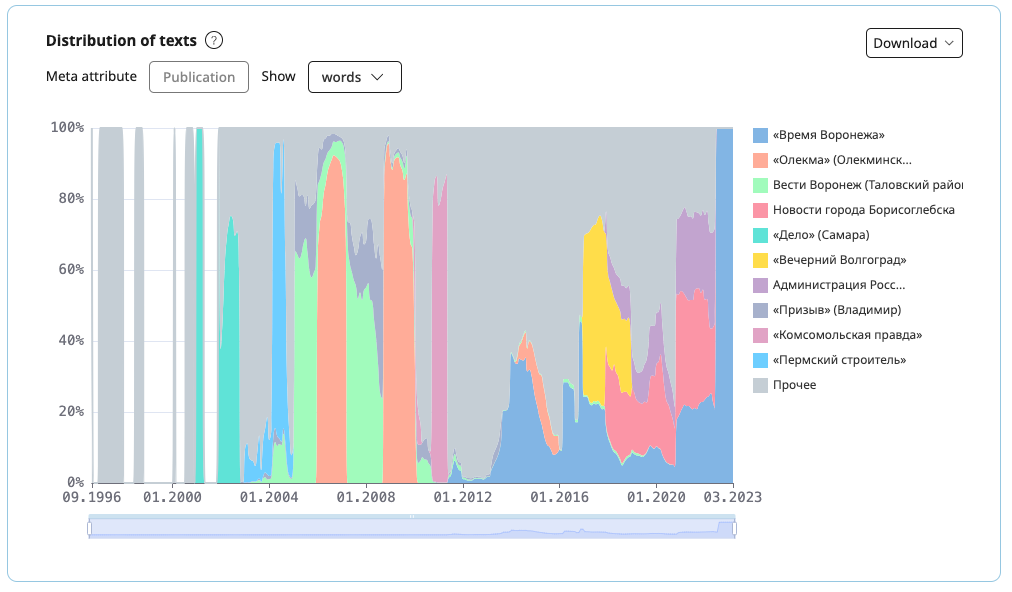
The graph shows the distribution of the top 10 values of the selected meta attribute. The remaining values are merged into the Other category. To the right of the graph there is a list of values. When you hover the mouse over a sector of the graph, you can see the name of the value and the corresponding number and share of texts or words in the corpus.
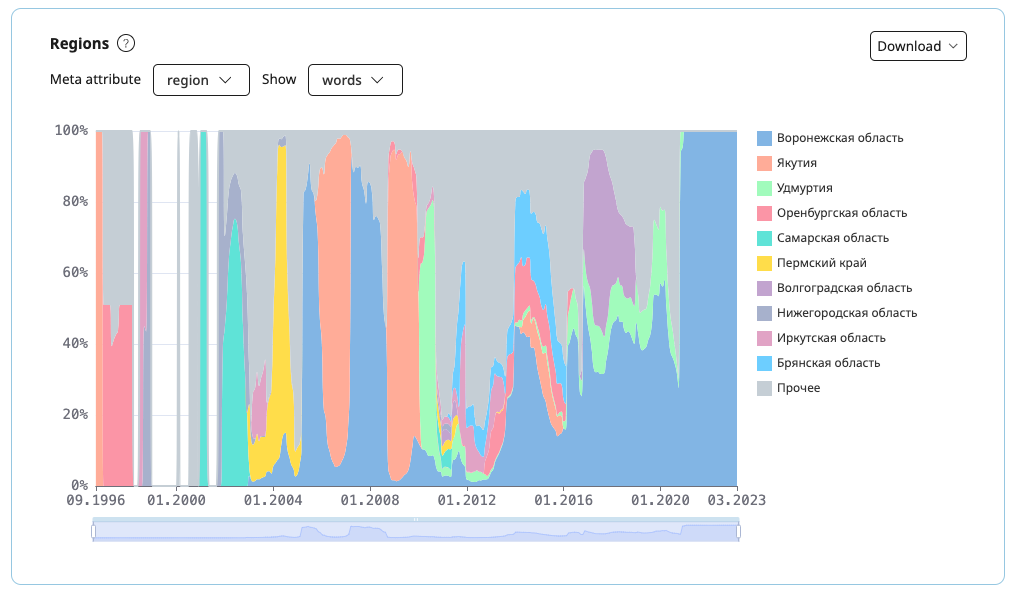
Regions
The graph shows the diachronical distribution of the texts in the corpus by country and region. When you switch the meta attribute and/or units of measurement, the graph gets redrawn.
To the right of the graph there is a list of values. When you hover the mouse over the shaded area, you can see the name of the region and the corresponding number and share of texts or words in the corpus.